AI Shoe Recognition for Race Sponsorship & Market Insights
Turn race footage into measurable brand visibility data. Our AI analyzes finish-line video to detect running shoe brands and convert them into aggregated insights for race organizers, sponsors, and sports marketing teams.
- Which running shoe brands appear most among finishers?
- How visible are sponsor brands during the race?
- What is the estimated brand share among runners?
- How can organizers use race media to create new sponsorship value?
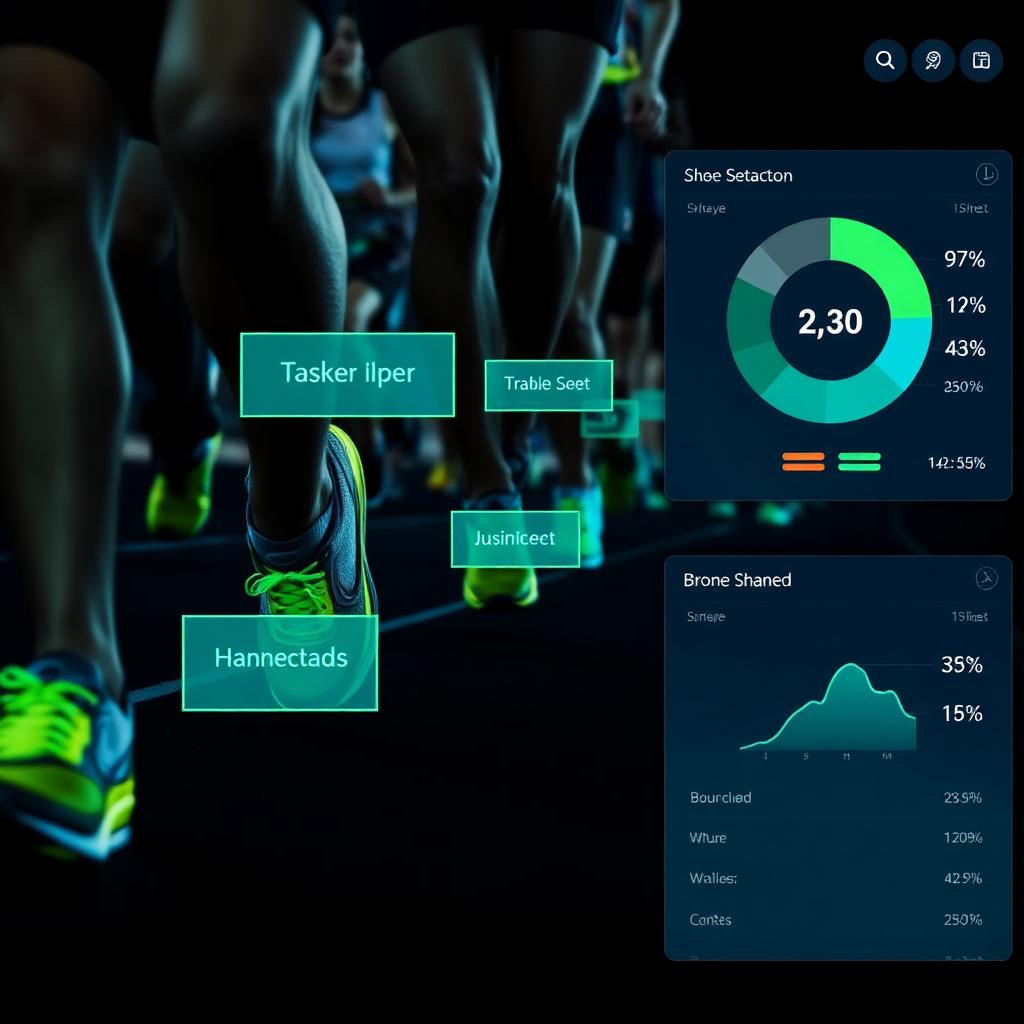
AI Model Development & Race Data Dashboard
The first phase focuses on running shoe brand recognition — brand-level visibility and aggregated reporting, with no individual runner identification required.
AI Model Development
Trained to detect shoes from race video frames and classify them by brand. Output is focused on brand-level visibility and aggregated reporting.
What the AI demo shows
- Shoe detection from uploaded or sample race images
- Brand classification
- Confidence score
- Visual detection area around the shoe
- Example output for brand recognition
Race Data Dashboard
Recognition results are processed and released in dashboard stages — early signals first, deeper analysis as more runners are processed.
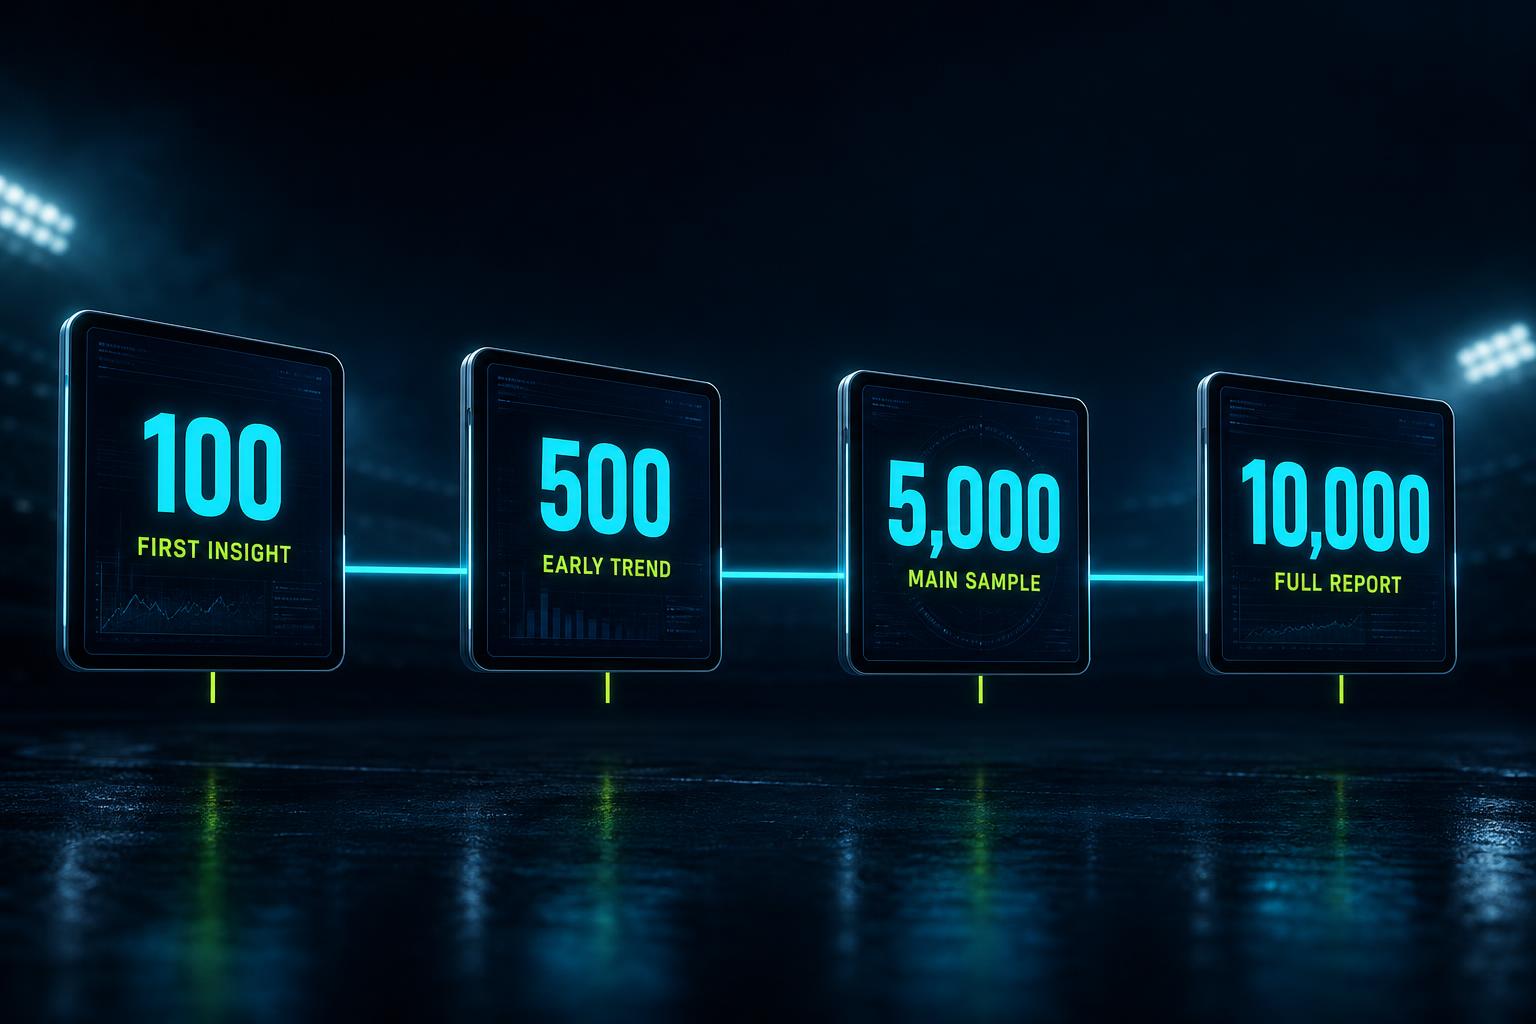
| Stage | Scope | Timing |
|---|---|---|
| First Insight | First 100 finished runners | ~30 min after stage reached |
| Early Trend | First 500 finished runners | ~30 min after stage reached |
| Main Sample | First 5,000 finished runners | ~30 min after stage reached |
| Full Report | ~10,000 runners | ~3 hours after race finish |
Dashboard insights
- Brand share by detected shoes
- Top visible shoe brands
- Sponsor brand visibility
- Brand comparison: sponsor vs non-sponsor
- Detection confidence overview
- Processing progress
- Trend by race period or finisher group
Get the model race-ready
Before race day, the AI model needs a prepared dataset for each target brand and a structured testing pass to reduce risk at the event.
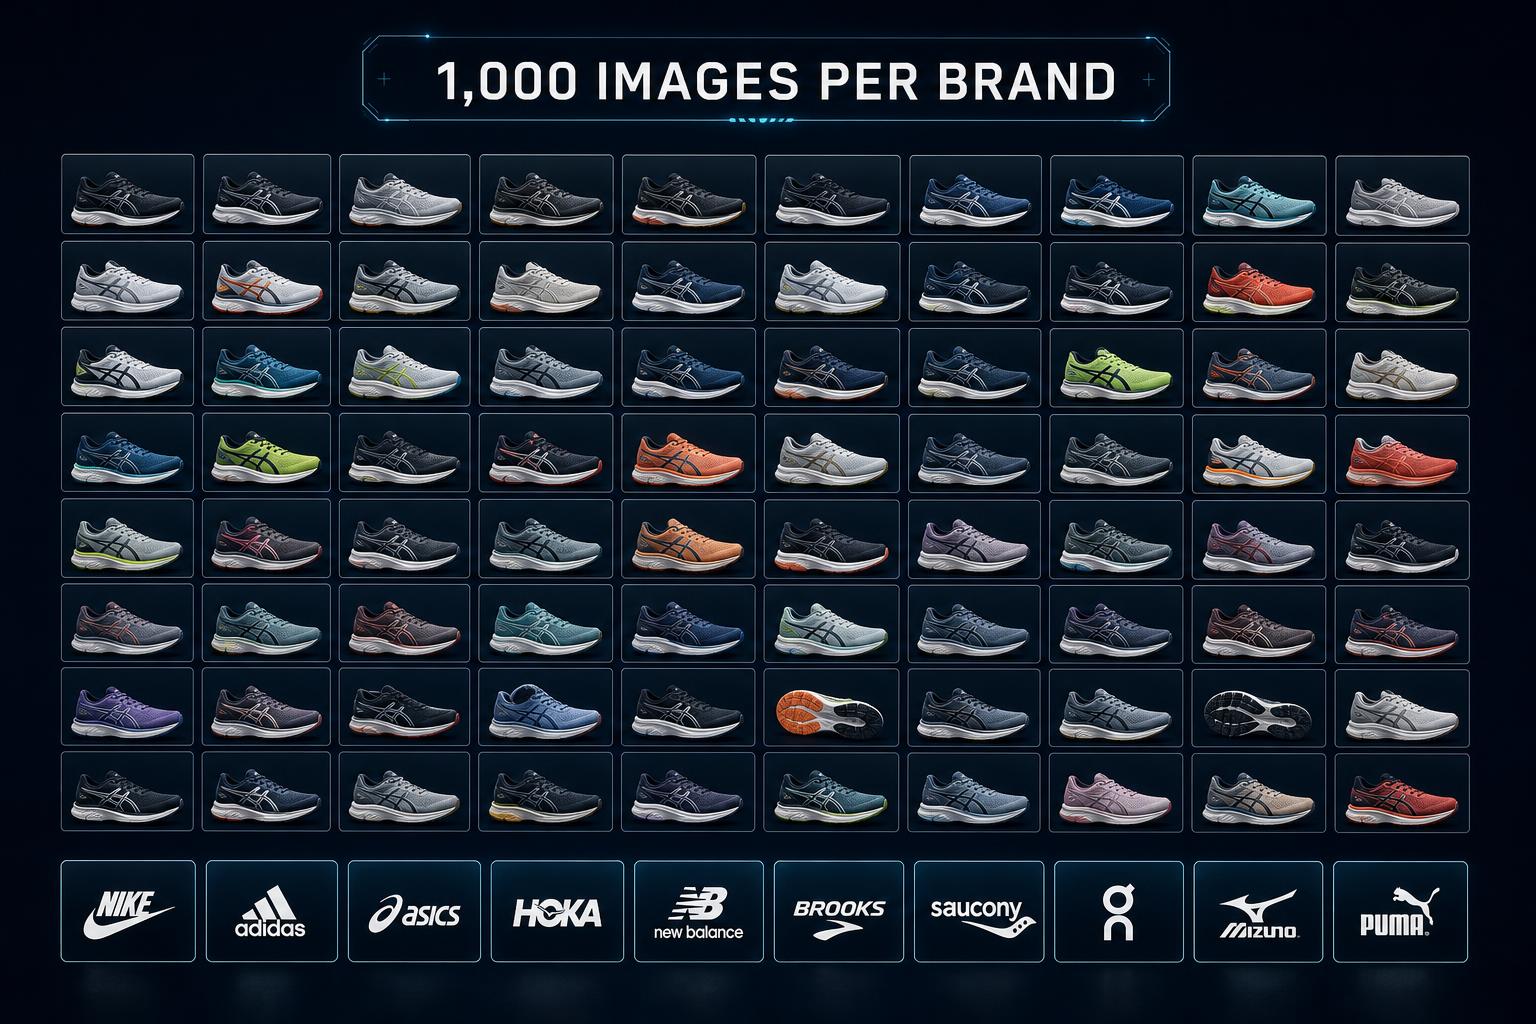
Shoe Image Dataset
The goal is solid performance under race conditions — motion blur, partial obstruction, different angles, and changing light.
- ~1,000 shoe images per brand
- Multiple shoe angles
- Different colors and models
- Outdoor and indoor lighting variations
- Clean brand labels for training and testing
- Realistic running images when available
AI Model Performance Testing
Before deployment, the model is tested to confirm it performs well with the selected target brands.
- Brand recognition accuracy
- False positive review
- False negative review
- Confidence score threshold
- Performance with motion blur
- Performance with different lighting
- Processing speed
- Dashboard data accuracy
What we set up at the finish line
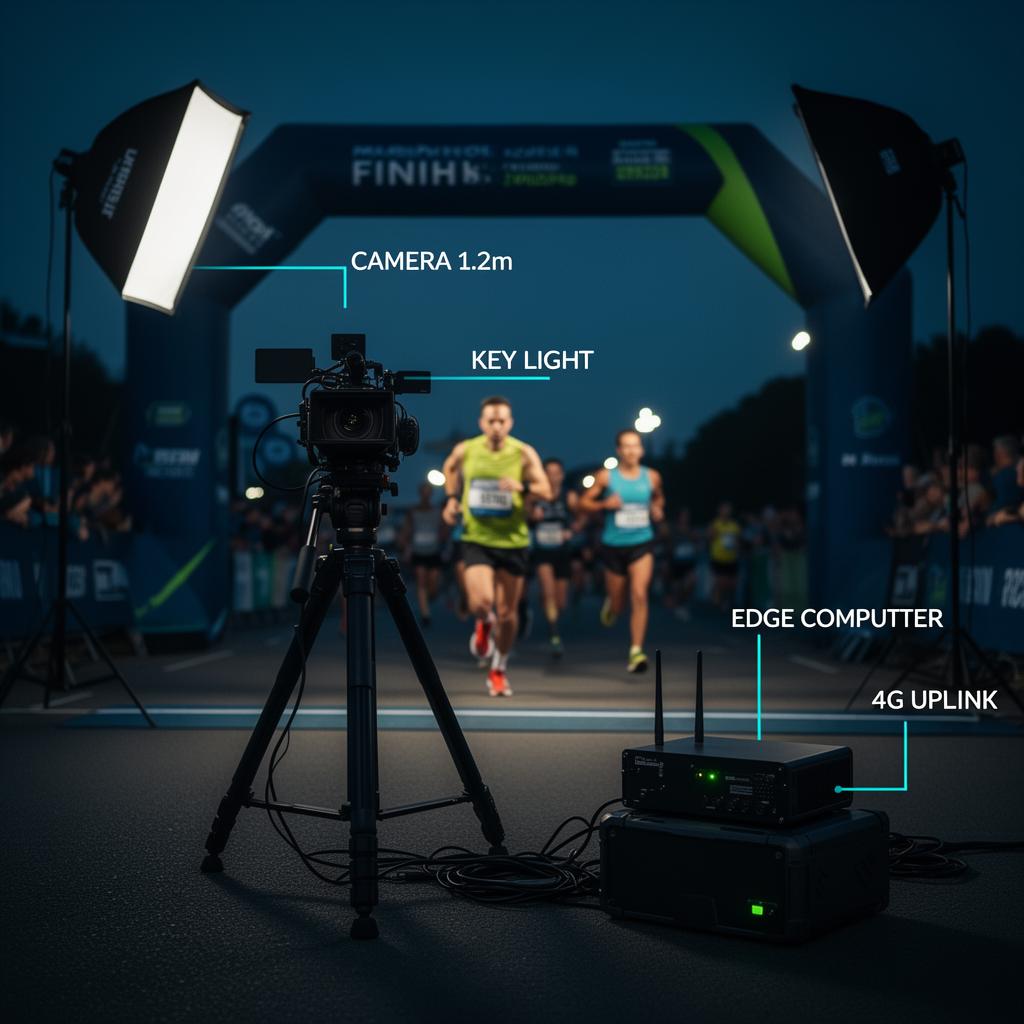
Video Position Before the Finish Line
Position the camera before the finish so runners are still moving forward and shoes can be captured clearly.
- Position before the finish line
- Clear view of lower body and shoes
- Stable camera angle
- Limited obstruction from barriers or staff
- Avoid overly wide shots
- Test sample footage before race start
Lighting at the Shooting Spot
Lighting quality directly affects recognition — the area must be bright enough for shoe shape, color, and brand details.
- Avoid dark areas
- Reduce strong shadows on shoes
- Avoid glare into the camera
- Add lighting for early/late or shaded finish areas
- Test the footage before the race begins
Edge Computer at the Video Spot
An edge computer near the camera supports fast processing and reduces raw video upload.
- Receive the video feed
- Extract useful frames
- Run AI detection or pre-processing
- Send recognition data to the cloud dashboard
- Support near-real-time reporting
- Reduce bandwidth requirements
Internet Access
A stable upload connection sends processed recognition data to the dashboard and reporting system.
- Stable upload connection
- Backup internet connection recommended
- Secure network access
- Test connection before the race
- Monitor connection during the race
- Fallback process if the connection is unstable
From camera to sponsor report
Capture
Race video is captured from the prepared camera position before the finish line.
Detect
The AI system detects visible running shoes from the video frames.
Recognize
Detected shoes are classified by brand with a confidence score.
Aggregate
Results aggregate into brand-level statistics — no personal identification.
Dashboard
Updated in stages for the first 100, 500, 5,000, and the full runner set.
Report
A final report supports sponsor reporting and future sponsorship planning.
Value for organizers and sponsors
For Race Organizers
Create new value from race media and finish-line footage.
- Create a new data product for sponsors
- Improve sponsorship proposal quality
- Provide post-race sponsor reports
- Understand runner product behavior
- Build stronger evidence for sponsorship pricing
For Sponsors
Measure actual brand visibility among runners — beyond logo placement or estimated audience numbers.
- Understand brand presence among participants
- Compare visibility with competing brands
- Measure product exposure during the race
- Use race data for sports marketing planning
- Evaluate sponsorship value with clearer evidence
Sponsor visibility and market insight reports
Sponsor Visibility Report
How sponsor brands appear in the race footage.
- Sponsor brand detection count
- Sponsor brand share percentage
- Sponsor ranking among all detected brands
- Visibility trend across race period
- Comparison with major competing brands
Market Insight Report
Aggregated shoe brand distribution among race participants.
- Overall brand share
- Top 10 detected shoe brands
- Brand popularity by finisher group
- Brand trend by race timing
- Detection confidence summary
- Estimated market insight from race participants
Privacy Positioning
The system is designed for aggregated product and sponsorship insights. In Phase 1, the analysis focuses only on running shoe brand visibility — not individual runners.
- Brand recognition only in Phase 1
- No individual runner identification required
- Aggregated dashboard and report
- Event footage used only for agreed analysis purposes
- Aligned with organizer data and consent policy
From Finish-Line Video to Sponsorship Intelligence
With the right preparation, camera setup, lighting, edge processing, and dashboard reporting, every race becomes a new source of sponsor value and product intelligence.